Brood 6: Thermoregulation
Hive temperatures
There is increasingly a number of systems by which the physical conditions within the hive can be monitored i.e. temperature, humidity, sound. I am sure theses methods will become more available as the technology becomes more sophisticated and hence simpler and cheaper. In the future perhaps a system for monitoring the conditions inside of the hive will become standard without the beekeeper having to have masters degrees in electronics and computer programming!
An idea of what the future might hold for the beekeeper can be viewed on the OpenEnergyMonitor website. Unfortunately this diy project uses electronic modules the setup of which would be beyond the capabilities of most beekeepers. The results shown are very interesting. The designers of this system have produced a visually pleasing dashboard and graph.
Here the temperature is measured by 4 probes placed in different parts of the hive. The temperatures are viewed either on the dashboard or plotted graphically against time and viewed live on line. It is particularly instructive to view the results over a 12 month period.
Each temperature is colour coded.
 the blue line traces the ambient temperature through the night and day cycle. (The probe is outside the hive).
 the yellow line shows the temperature inside the hive but just below the crown board and reflects the night and day cycle
 but as expected is higher than the ambient temperature.
 the red line represents the temperature in the super. Again this temperature is higher than the ambient but is also higher
than the former. It indicates the high specific heat of the sealed honey which acts as a storage heater; any
temperature variation is buffered.
It is interesting to note that the temperature also follows a daily cycle but its peak is in the early hours of the morning.
Are there more bees working on the honey during the night thus increasing the temperature?
 the green line is perhaps the most surprising in so far as it remain constant at 35 ˚C throughout the night and day cycles.
The bees are able to adjust any temperature fluctuation that might be expected to occur.
Thermoregulation of the brood nest
It is a characteristic of Apis mellifera that the species is able to regulate its brood nest temperature. Only with this ability was A. m mellifera able to colonise the more temperate parts of Europe and Russia.
The mechanism by which this thermoregulation takes place depends on the ambient temperature.
If the brood nest exceeds 35 ˚C then the bees bring about cooling by collecting and allowing water to evaporate, and by fanning.
To maintain the brood nest temperature at 35 ˚C special bees which are able to raise their own body temperature to the 40 ˚C mark sit over the sealed brood cells whilst other bees provide an insulating packaging around them. The brood itself also produces metabolic heat during its development.
What advantage does the beekeeper gain by knowing the brood nest temperature? Some possible scenarios are proposed as follows:
An idea of what the future might hold for the beekeeper can be viewed on the OpenEnergyMonitor website. Unfortunately this diy project uses electronic modules the setup of which would be beyond the capabilities of most beekeepers. The results shown are very interesting. The designers of this system have produced a visually pleasing dashboard and graph.
Here the temperature is measured by 4 probes placed in different parts of the hive. The temperatures are viewed either on the dashboard or plotted graphically against time and viewed live on line. It is particularly instructive to view the results over a 12 month period.
Each temperature is colour coded.
Thermoregulation of the brood nest
It is a characteristic of Apis mellifera that the species is able to regulate its brood nest temperature. Only with this ability was A. m mellifera able to colonise the more temperate parts of Europe and Russia.
The mechanism by which this thermoregulation takes place depends on the ambient temperature.
If the brood nest exceeds 35 ˚C then the bees bring about cooling by collecting and allowing water to evaporate, and by fanning.
To maintain the brood nest temperature at 35 ˚C special bees which are able to raise their own body temperature to the 40 ˚C mark sit over the sealed brood cells whilst other bees provide an insulating packaging around them. The brood itself also produces metabolic heat during its development.
What advantage does the beekeeper gain by knowing the brood nest temperature? Some possible scenarios are proposed as follows:
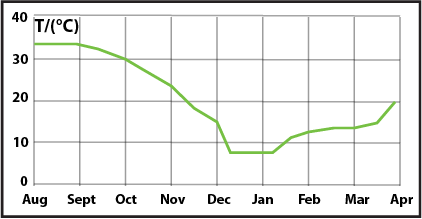
During and after the winter
The Queen has gone off lay and the temperature of the cluster reaches a minimum in mid December.
The Queen starts to lay a few eggs at the beginning of January and by February/March a couple of brood frames are laid up.
The brood nest temperature rises from the upper 10's to
35 ˚C and remained constant over the summer months.
Clearly a queen is present and there is no need to disturb the colony.
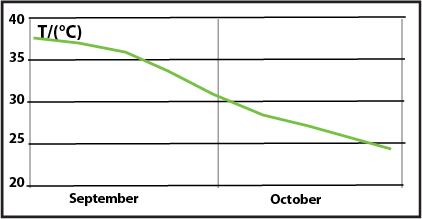
After the summer
This graph shows what is expected in late September.
The brood nest steadily contracts as the queen goes off lay in readiness for the winter i.e. no more new brood is seen. The temperature gradually falls away as the mature brood emerges.
A similar graph might be expected if the queen goes off lay in a poor season when there is a dearth of forage.
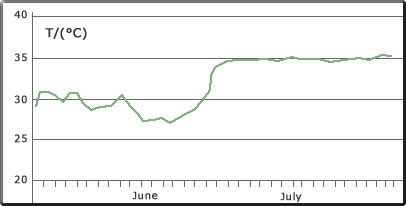
New Queen mated
In this case a virgin queen was introduced to a nuc containing no brood towards the end of June.
The bees maintained a temperature in the upper 20's during the time the queen gets mated. Once she started to lay up a brood comb the temperature quickly rose to 35 ˚C and remained constant.
In this case a virgin queen was introduced to a nuc containing no brood towards the end of June.
The bees maintained a temperature in the upper 20's during the time the queen gets mated. Once she started to lay up a brood comb the temperature quickly rose to 35 ˚C and remained constant.
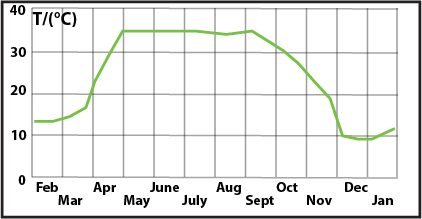
The Annual Cycle
This graph shows a typical temperature variation throughout the year for an average colony.
The main points to note are:
The steady temperature of about 35 °C over the summer months - mid April to mid September.
The gradual decline in the temperature from September when the queen is going off lay.
And the relative low winter temperature when no brood is present.